EDA#
Here is a simple EDA example showing how generic information extraction can be valuable. This example illustrates how extracted metafeatures contain information that can be used to predict how many likes a tweet will receive.
Let’s start by enriching our tweets dataset again:
from elemeta.dataset.dataset import get_tweets_likes
tweets_eda = get_tweets_likes().sample(5000)

Let’s start by enriching our tweets dataset
from elemeta.nlp.runners.metafeature_extractors_runner import MetafeatureExtractorsRunner

metafeature_extractors_runner = MetafeatureExtractorsRunner()
print("The original dataset had {} columns".format(tweets_eda.shape[1]))

# The enrichment process
print("Processing...")
tweets_eda = metafeature_extractors_runner.run_on_dataframe(dataframe=tweets_eda,text_column='content')
print("The transformed dataset has {} columns".format(tweets_eda.shape[1]))
Now let’s enrich the data:
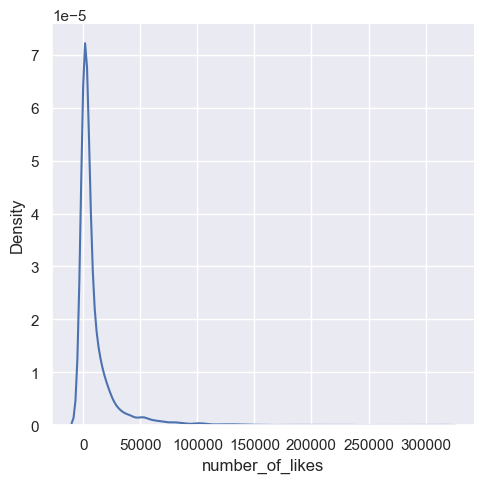
Let’s look at the distribution of labels (number of likes). We can clearly see a long right-tail distribution.
import seaborn as sns
import matplotlib.pyplot as plt


sns.displot(tweets_eda, x="number_of_likes",kind="kde")
According to the below analysis, there is a clear correlation between tweet language and likes, since number_of_likes distribute differently between languages.
plt.subplots(figsize=(10,7))
sns.boxplot(x="detect_language", y="number_of_likes", data=tweets_eda);

Apart from a few outliers, tweets with at least one emoji get more likes.
tweets_eda['has_emoji'] = tweets_eda['emoji_count'].apply(lambda x: 'False' if x <= 0 else 'True')
plt.subplots(figsize=(10,7))
sns.boxplot(x="has_emoji", y="number_of_likes", data=tweets_eda)

For a full working example please use the following Google Colab